Candlestick Construction
The Japanese candlestick lines tend to have a candle like appearance. Candlestick lines are constructed as follows:

Tip: If an ID with an equal to value exists in the Key Pattern, Patterns will prompt "Key Pattern contains an equal to value for the following ID": "ID-name." If the equal to value for the ID listed is an important criterion for your search, select Y yes to override the ID's formula and find only equal to matches. The Equals-To ID override works on all the ID's.
Advance Block
A group of three white candlestick lines with consecutively higher closes, and progressively smaller bodies.

For Patterns users...
Parameters
Key Pattern Type: 3-bar
Key Pattern Size: 3-bar
Pattern-IDs
Open to Close, Closing 1,
Closing 2, Opening 1, Inner 1
Counterattack Lines
A Counterattack Line formation occurs when two opposite color candles have the same close.
For Patterns users...
 Parameters
Key Pattern Type: 2-bar
Key Pattern Size: 2-bar
Pattern-IDs
Open to Close, Intra Close, Intra Open,
Closing 1, Opening Gap 1
NOTE: Closings are equal to the previous closings for Counterattack Lines. Select Equals-To ID override on the Closing 1 ID when running the search.
Dark Cloud Cover & Piercing Line
The Piercing Line is considered a buy signal in short to intermediate term corrections in bull markets. The Dark Cloud Cover is considered to be a key reversal pattern in an up trend but is more often used to signal the end of a short to intermediate bounce in a bear market. Opposite of the Piercing Line, the classic Dark Cloud Cover opens above the preceding white candle's high and closes below the white candle's midpoint. Shadows are ignored.
For Patterns users...

Parameters
Key Pattern Type: 2-bar
Key Pattern Size: 2-bar
Pattern-IDs
Open to Close, Intra Close,
Intra Open, Opening 1, Close-Inner 1
Engulfing Patterns
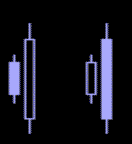
These patterns are considered to be key reversal patterns. The body colors for the bullish and bearish Engulfing Lines should be as illustrated below. The engulfment pertains to the real body engulfing the preceding real body. Thus, the High-High and Low-Low 1 IDs are not needed. Shadows are ignored.
 For Patterns users...
Parameters
Key Pattern Type: 2-bar
Key Pattern Size: 2-bar
Pattern-IDs
Open to Close, Opening 1,
Close to Open 1
Hanging Man & Hammer
This formation is called a Bearish Hanging Man when following an up trend and a Bullish Hammer when following a down trend. The physical description for the Hanging Man and the Hammer are the same. Opposite the Hammer the Hanging Man follows an up trend. The body for either formation can be white or black. To qualify as a Hammer or Hanging Man the stem must be at least 2 times that of the open to close body and there should be little or no stem above the body.

For Patterns users...
Parameters
Key Pattern Type: 1-bar
Key Pattern Size: 1-bar
Pattern-IDs
Intra Close, Intra Open,
Inner Range
Harami
This formation is considered Bearish following an up trend and a Bullish when following a down trend. Most often the classic Harami consists of an opposing real body color, as illustrated below. However, the two bodies can be the same. Thus, the Open to Close ID is optional. The Open to Close ID is recommended if the smaller real body is a Doji (Harami Cross). Select the Equals-To ID override on the Open to Close ID for a Harami Cross.

For Patterns users...
Parameters
Key Pattern Type: 2-bar
Key Pattern Size: 2-bar
Pattern-IDs
Closing 1, Opening 1,
Close to Open 1, Open to Open 1
Doji Stars
Doji Stars are considered bearish when following an up trend and bullish when following a down trend. This pattern is said to be most reliable when occurring soon after a market establishes a new high or low. Doji is a candlestick line that has the same opening and closing price. A Doji Star occurs when the Doji's open and close holds (gaps) above or below the preceding real body.
 For Patterns users...
Parameters
Key Pattern Type: 2-bar
Key Pattern Size: 2-bar
Pattern-IDs
Open to Close, Inner-Range,
Opening 1
NOTE: If the Doji is an important criterion for your search, select the Equals-To ID override on the Open to Close ID.
Evening Star & Evening Doji Star
These formations are considered to be one of the most reliable key reversal sell patterns, especially at new highs. The star is the small white real body. The star may also be a Doji that makes up the Evening Doji Star as illustrated. Ideally the star's body holds above (gaps) the preceding and following bodies. The long black line (most recent bar) closes below the midpoint of the first body.

For Patterns users...
Parameters
Key Pattern Type: 3-bar
Key Pattern Size: 3-bar
Pattern-IDs
Open to Close, Opening 1,
Open to Open 1, Close to Inner 2, Inner-1
NOTE: For the Evening Doji Star select the Equals-To ID override on the Open to Close ID.
Morning Star & Morning Doji Star
These formations are considered as key reversal buy patterns. The physical appearance is the exact opposite of the Evening Star and Evening Doji Star. The star gaps below the preceding and following real bodies. The long white line closes above the midpoint of the first body.
 For Patterns users...
Recommended parameters
Key Pattern Type: 3-bar
Key Pattern Size: 3-bar
Pattern-IDs
Open to Close, Opening 1,
Open to Open 1, Close to Inner 2,
Inner 1
NOTE: For the Morning Doji Star select the Equals-To ID override on the Open to Close ID.
Shooting Star
This formation is considered to be an excellent short term bearish pattern. The Shooting Star formation has a small real body with a long upper shadow. The star's body gaps above the preceding real body. The color of the body does not matter. The body preceding the gap should be relatively larger than the current body.
What we consider to be a gap is not important (where the current bar's low is above the preceding bar's high). The gap is from body to body only!
 For Patterns users...
Parameters
Key Pattern Type: 2-bar
Key Pattern Size: 2-bar
Pattern-IDs
Intra Close, Intra Open, Inner-Range,
Closing 1, Opening 1, Close to Open 1,
Open to Open 1
NOTE: The body of the candles can be white or black.
Tasuki Gaps
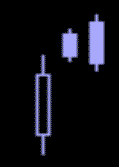
The black body of the upside Tasuki Gap (bearish) opens within the preceding white body. The two smaller bodies hold above the larger white body. The downside Tasuki Gap is the exact opposite.
For Patterns users...
Parameters
 Key Pattern Type: 3-bar
Key Pattern Size: 3-bar
Pattern-IDs
Open to Close, Opening 1,
Closing 2, Open to Open 1
Tweezer Tops & Bottoms
These formations are most often used as short term signals, but are also viewed as potential key reversal patterns. Tweezer patterns have equal highs at market tops, and equal lows at market bottoms. These patterns can consist of various types of candlestick lines. The type of lines that make up Tweezer Tops and Bottoms does not matter.
This formation is very quick and easy to test in Patterns and shows some very interesting statistics in various markets. For example, unlike what you may expect, the S&P 500 futures statistics reveal that the first day following a double bottom (Tweezer Bottom) is an up day in most cases. And the reverse for a Tweezer Top. However, the reversal does tend to take place within a few days.
For Patterns users...
 Parameters
Key Pattern Type: 2-bar
Key Pattern Size: 2-bar
Pattern-IDs
Open to Close, High-High 1
or Low-Low 1
NOTE: Use the High-High 1 ID for tops and the Low-Low 1 for bottoms with the Equals-To ID override. For Doji's you may want to use the Equals-To ID override on the Open to Close ID.
Upside Gap Two Crows
This pattern is considered as a sell signal and to be more significant at price levels of heavy resistance. The first black candle's real body holds (gaps) above the preceding white body. The second larger black candle opens above the preceding candles open, and closes below its close.
 For Patterns users...
Parameters
Key Pattern Type: 3-bar
Key Pattern Size: 3-bar
Pattern-IDs
Open to Close, Closing 1,
Open to Open 1